Managing quality in real time: which indicators, and how to make them reliable
From KPIs consolidated by hand in Excel to dashboards fed by the shop floor: choosing the right indicators and making sure they tell the truth.
Industry X.0 team6 min read
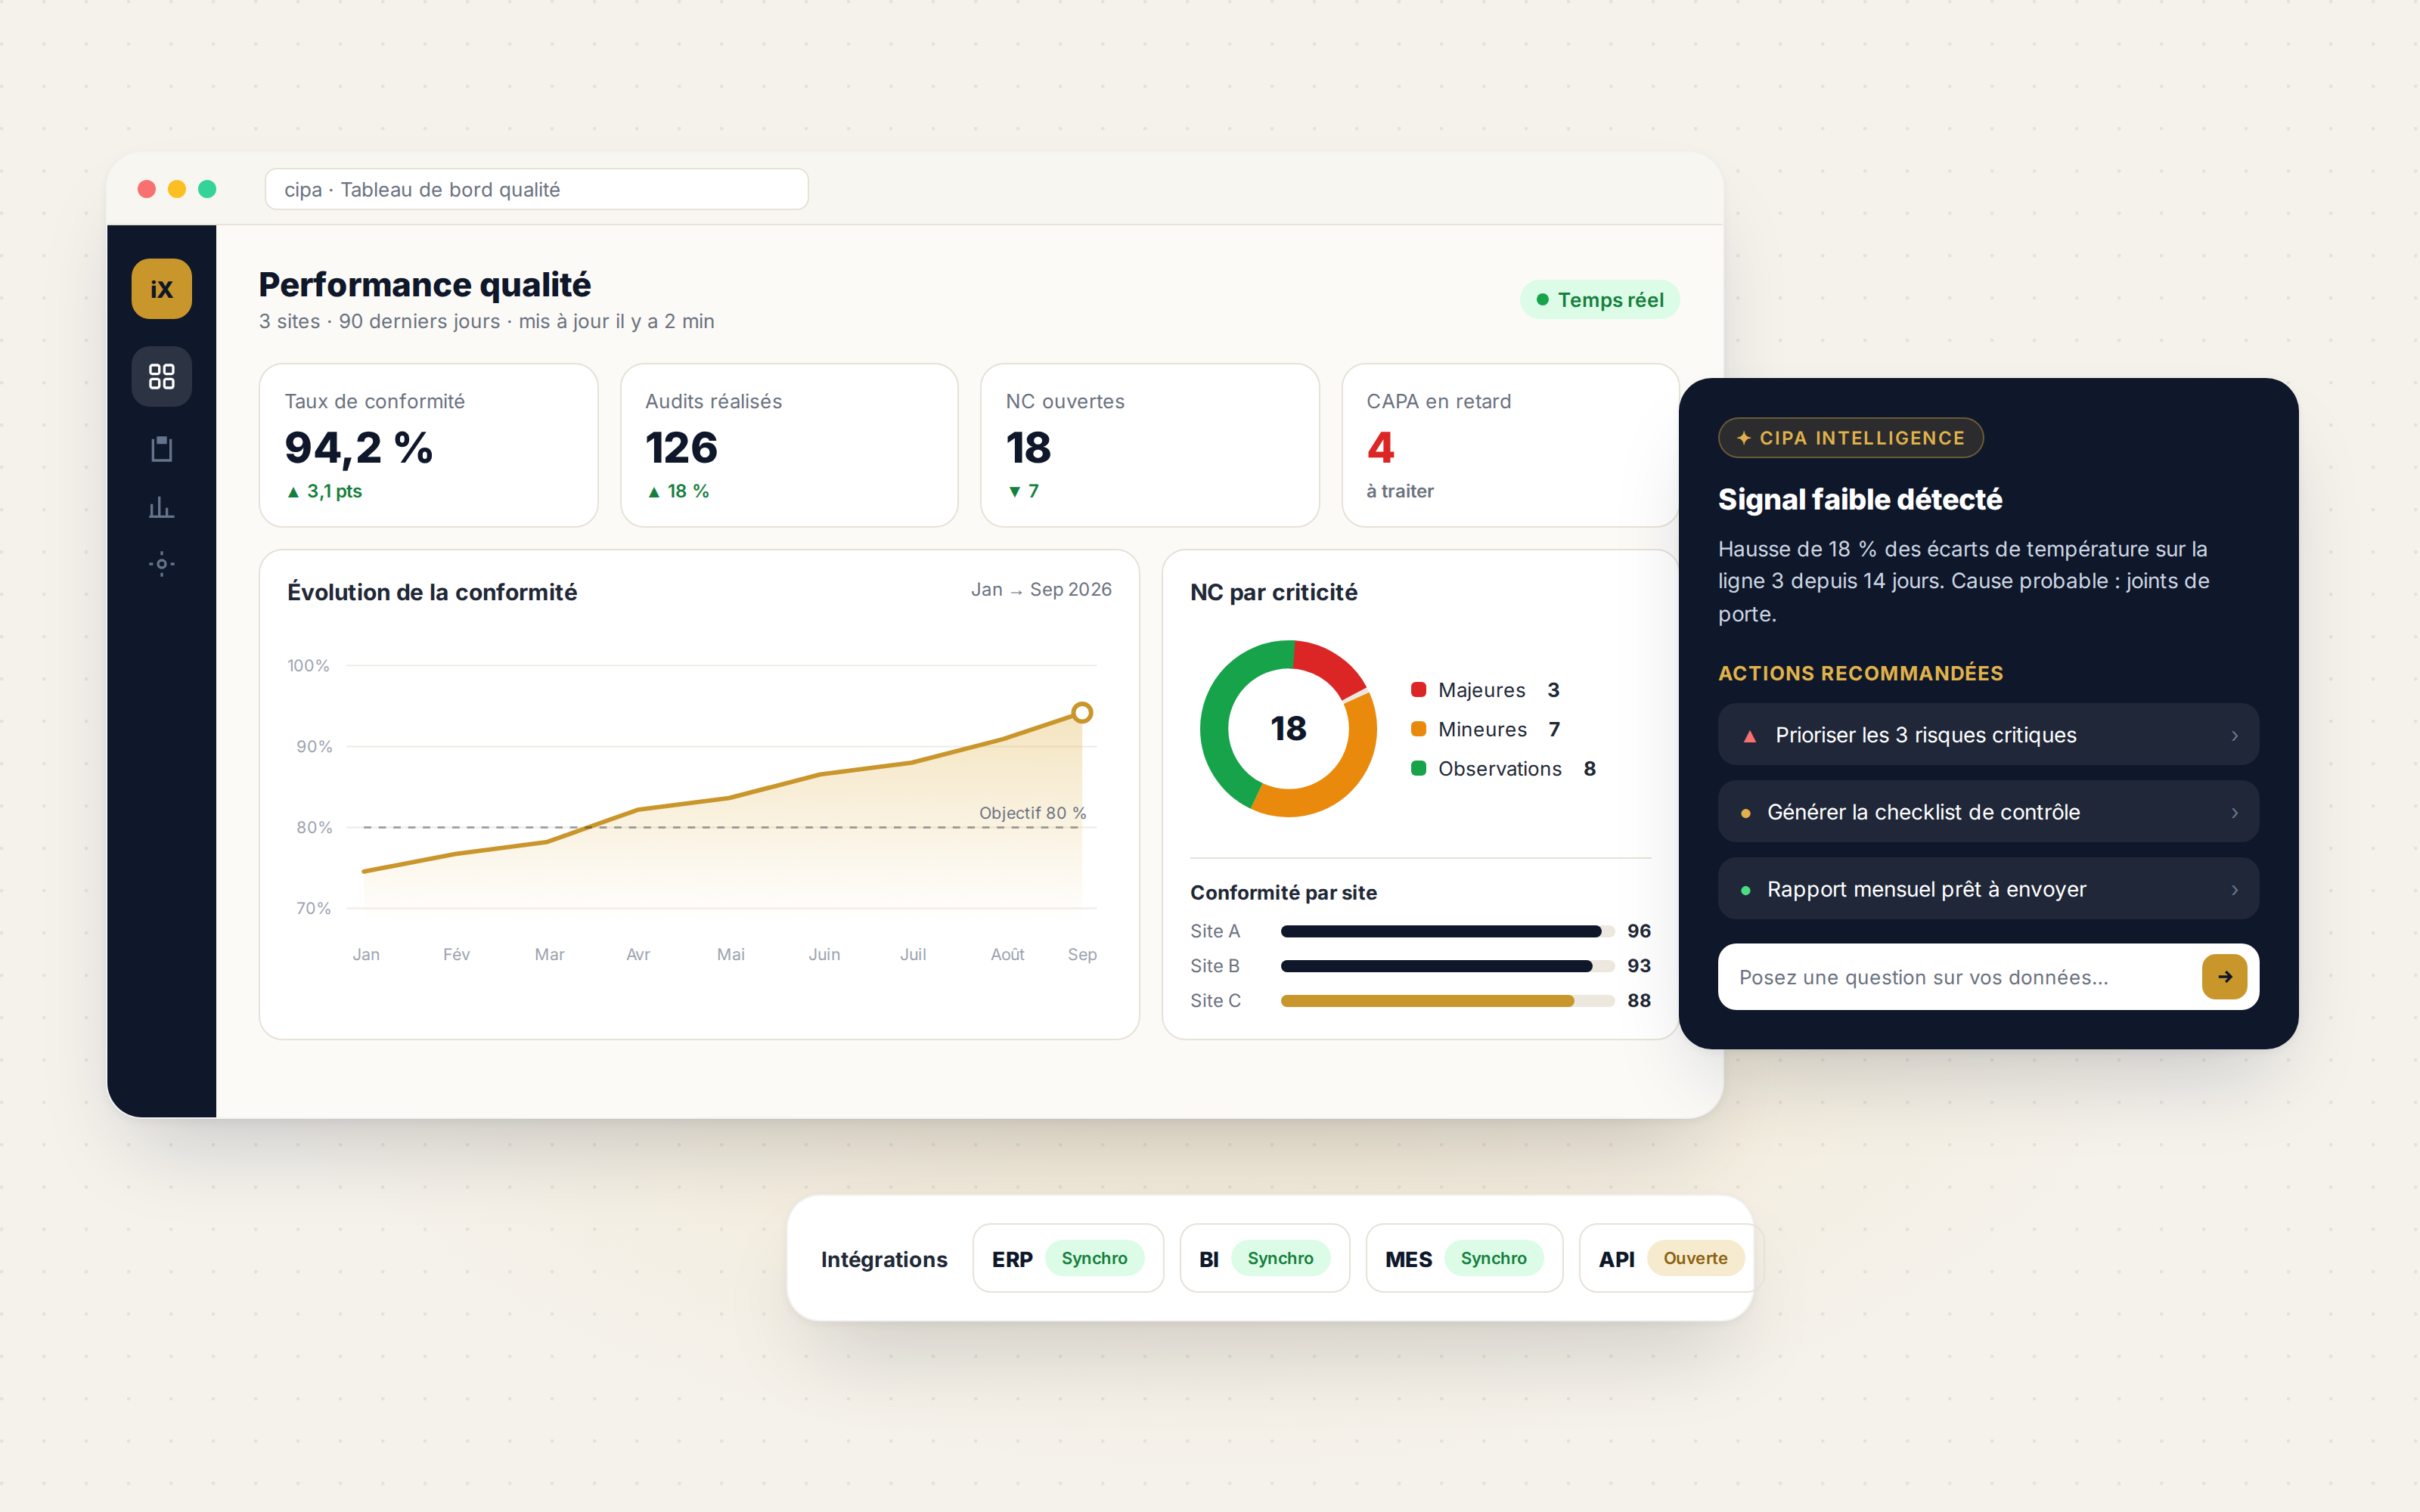
An indicator that arrives several days late describes the past, not the current situation. And two departments showing different figures for the same indicator spend the meeting arguing about the source. Managing in real time first means solving these two problems: data freshness and data reliability.
Few indicators, each tied to a decision
A useful dashboard fits on one screen. For every indicator you keep, ask a simple question: what decision do we take when it drifts, and who takes it? If there is no answer, the indicator is decoration.
- Audit and inspection compliance rate, by area and by line.
- Number of open deviations, by criticality and by age.
- Average time to handle non-conformities.
- Corrective actions overdue against their due date.
- Recurring deviations: same causes, same areas, same products.
Enter it once, at the source
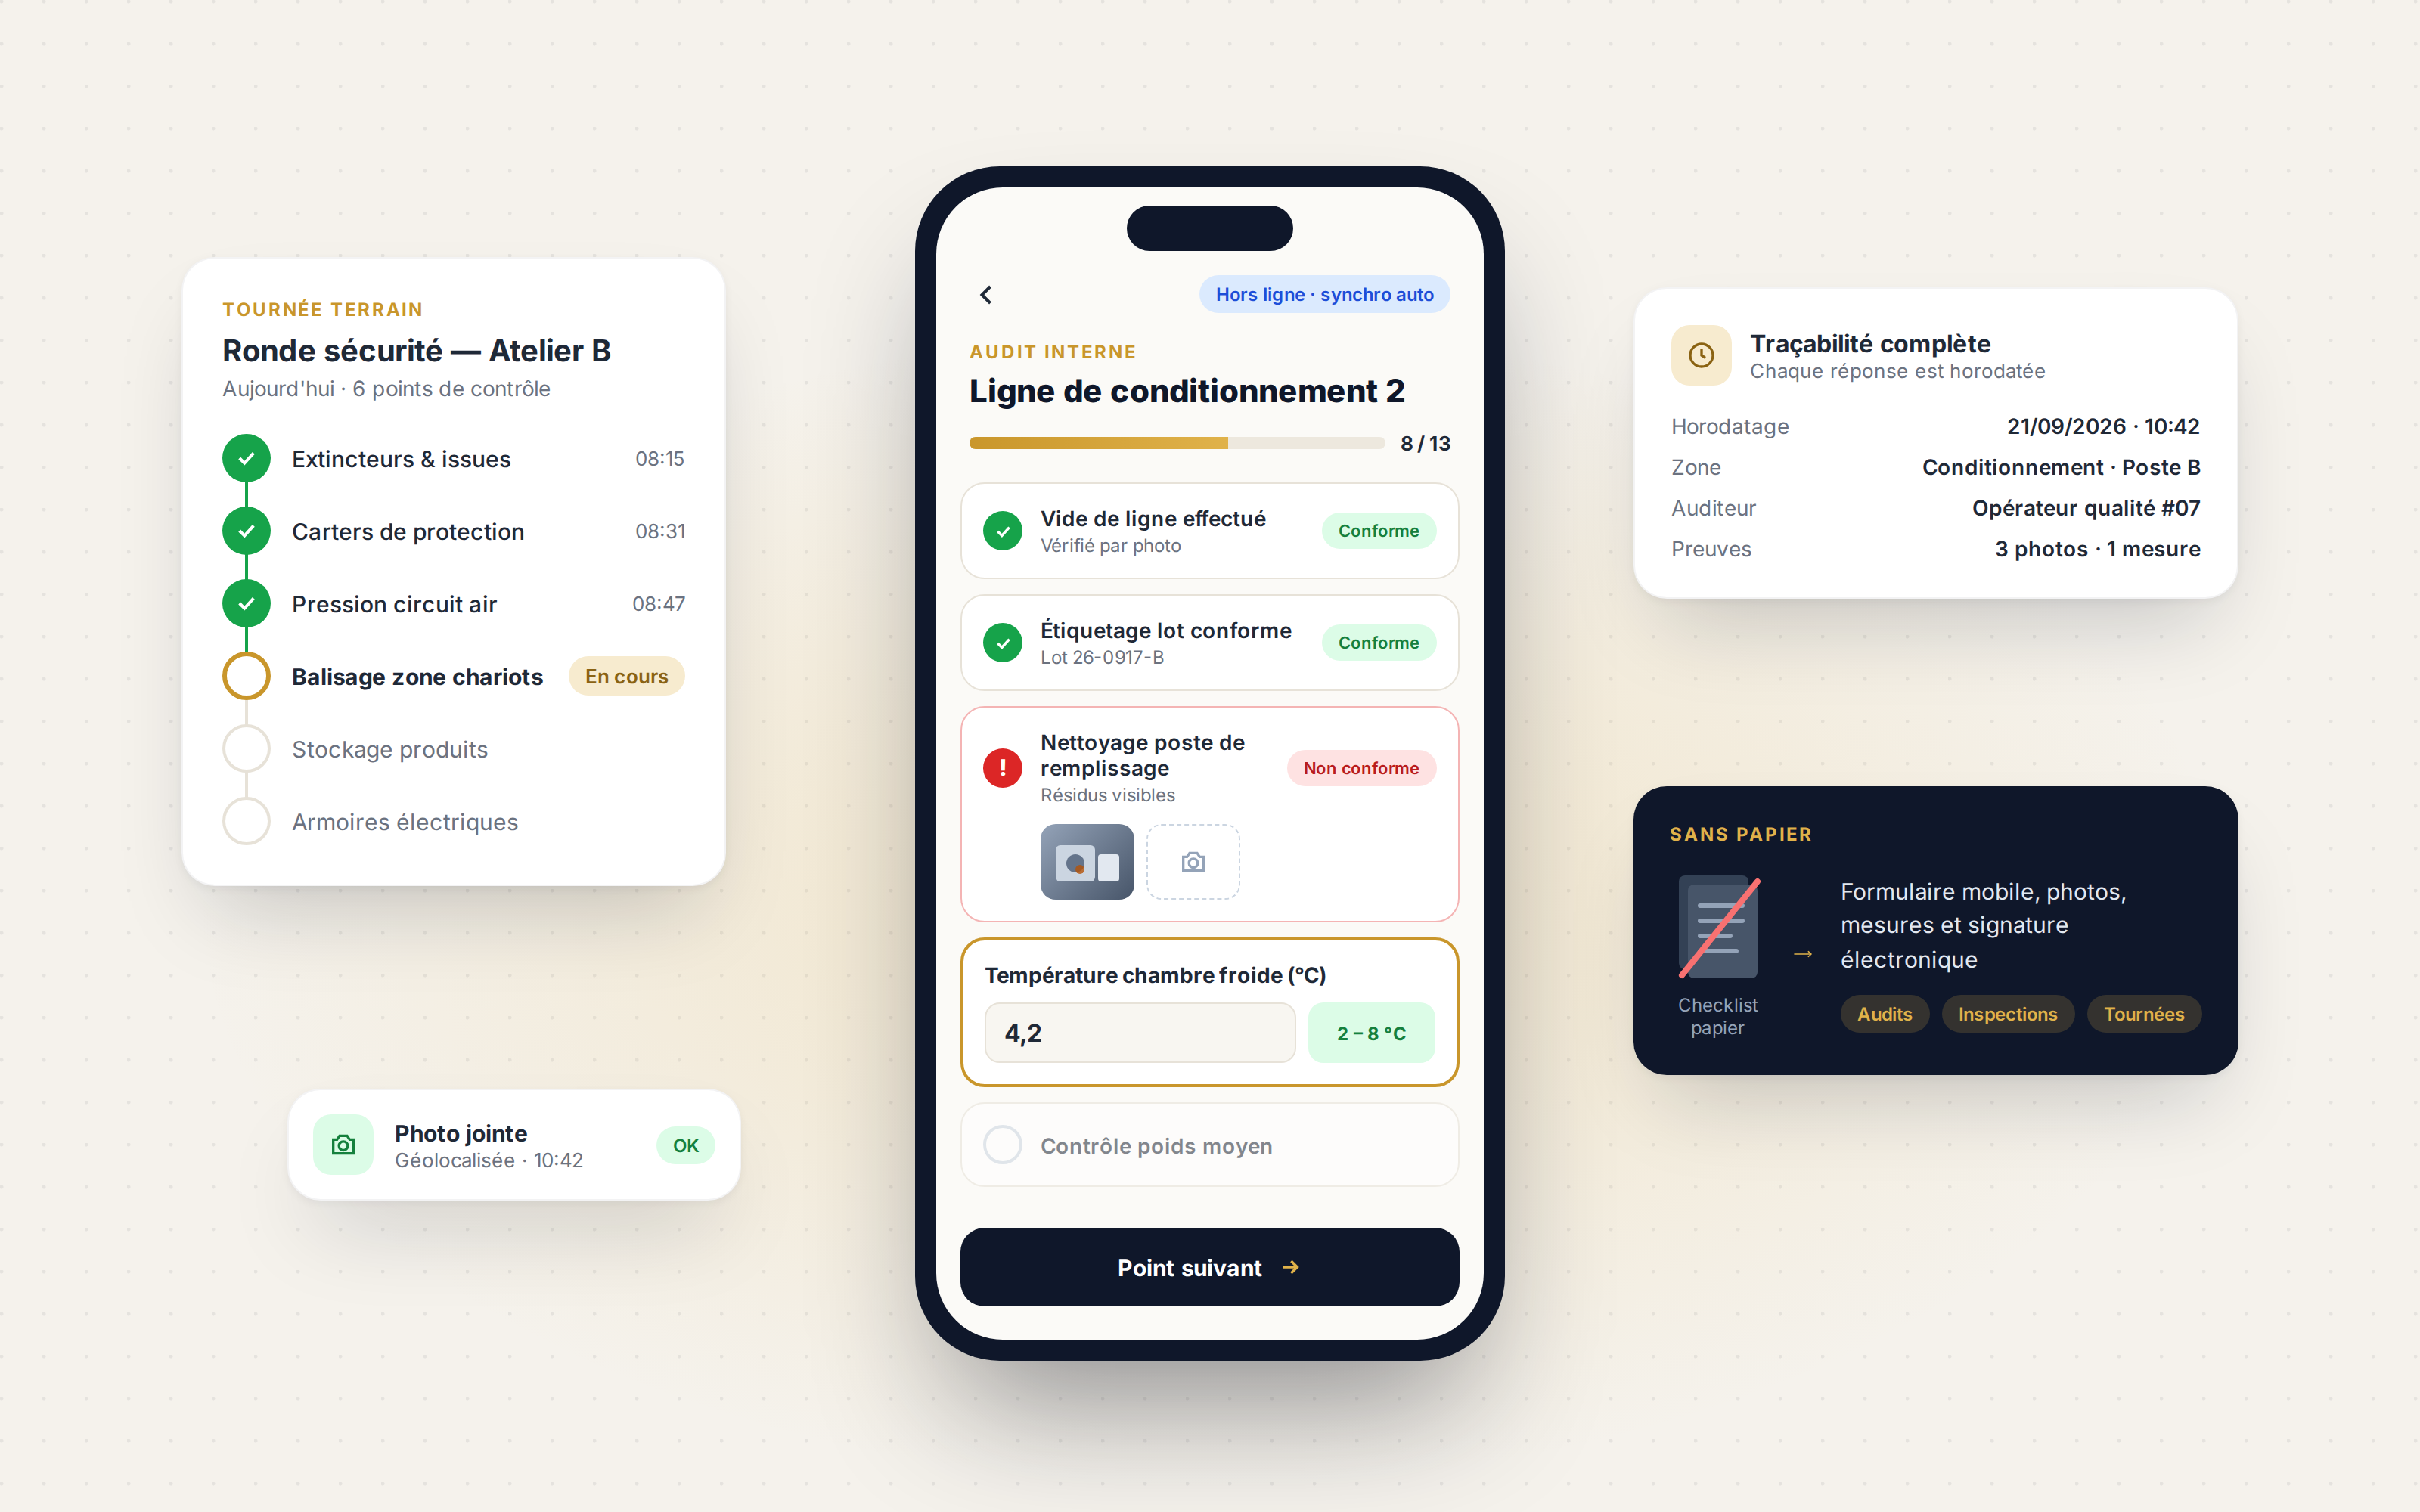
Manual consolidation is the leading cause of wrong or late indicators. When checks, audits and deviations are entered directly on the shop floor in a single repository, indicators are calculated with no retyping or copy-pasting, and everyone sees the same version of the figures.
Watch trends, not just values
A single value can wrongly reassure or alarm. Track trends by site, line and team: a slow drift is often more telling than a one-off spike. This is also where operational AI comes in, spotting weak signals and inconsistencies before they become incidents.
Connect rather than duplicate
Quality data takes on its full meaning when it joins the rest of the information system: ERP, MES, CMMS or BI tool. Defining these exchanges during scoping avoids manual exports and guarantees a single source of truth.
.png&w=3840&q=75)